
Lately, we've been seeing a lot of webinars, conferences, papers, all you can imagine about behavioral data, its usage, its pros and cons, how they can upgrade your research.... and while talking about it, the case of a very interesting presentation came back to our minds.
A couple of years ago, deep in the middle of a conference planning, we were trying to decide what we could present that would really embody the spirit of the use of behavioral data – going from raw data to useful insights. We needed a case study that would demonstrate the power of behavioral data.
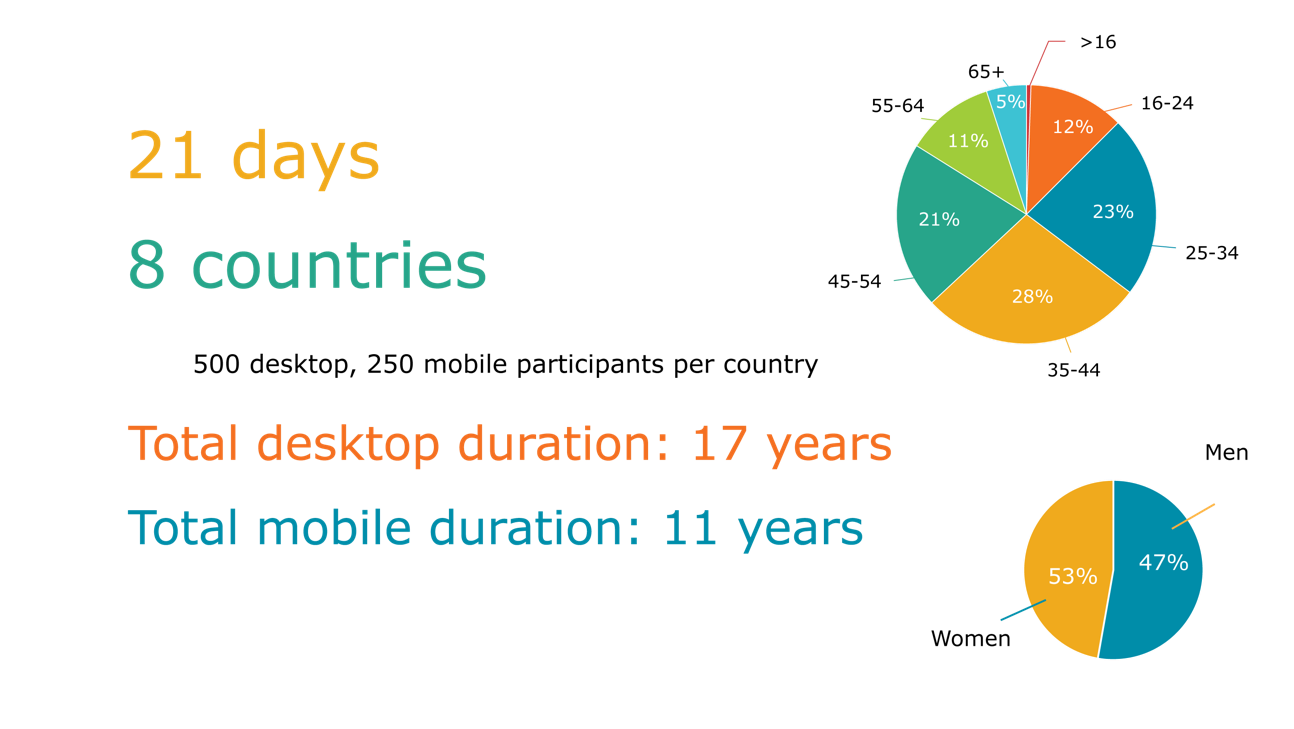
With that in the back of our minds, we started planning our biggest, most ambitious case study yet – tracking 500 people each in 8 different countries, only using Wakoopa's passive metering technology. We wanted to create a truly global study that would cover a range of different markets to demonstrate that our technology can be applied anywhere in the world.
Together with some of our global panel partners (GapFish, Respondi, GMO Research, SoapBoxSample, TEG Rewards, and Netquest), we created 'Around the world with behavioral data.' Enjoy!
What you're about to read, is only the first part of this study. So stay tuned for the next delivery ;)
The anatomy of behavioral data
Before we dive into the study, we think it is important to explain what we mean when we say we use our software to collect passively metered 'behavioral data'. What we really collect is the URL, which contains all the information we need to analyze what website they visited, when and for how long they visited it, as well as how they got there. While sometimes a URL can seem like one long string of letters and words, when we break it down, it becomes our guide to everything we need to know about the users' online behavior.
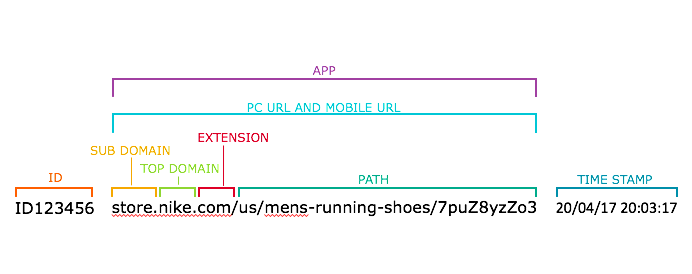
Each participant/panelist is given a unique ID – this is what we use to identify patterns of behavior from one user without having to use any personal information. Next comes the main part of the URL – the subdomain, top domain, and extension. After this, we can also see the 'path', namely which part of the website the user visited. If there was a referrer, we would also see where they came from in the path. If the URL contains a search query, this is also where we would find it. Finally, we collect the timestamp of each visit, so we can keep track of information such as how much time was spent on each visit, or what was the most active part of the day for our users. For app visits, this remains largely the same, except that the URL is replaced by an app ID.
Enriching the data
Using our collected behavioral data, we can then apply other information we already have, in order to turn this raw data into useful consumer insight.
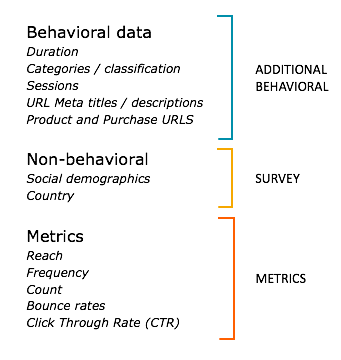
By using the information we have gathered from pre-tracking surveys (such as their age, gender, and location) we can start to segment our findings into different categories. Using pre-defined metrics, we can mix and match these various information points to extract the knowledge we want to have.
Research objective
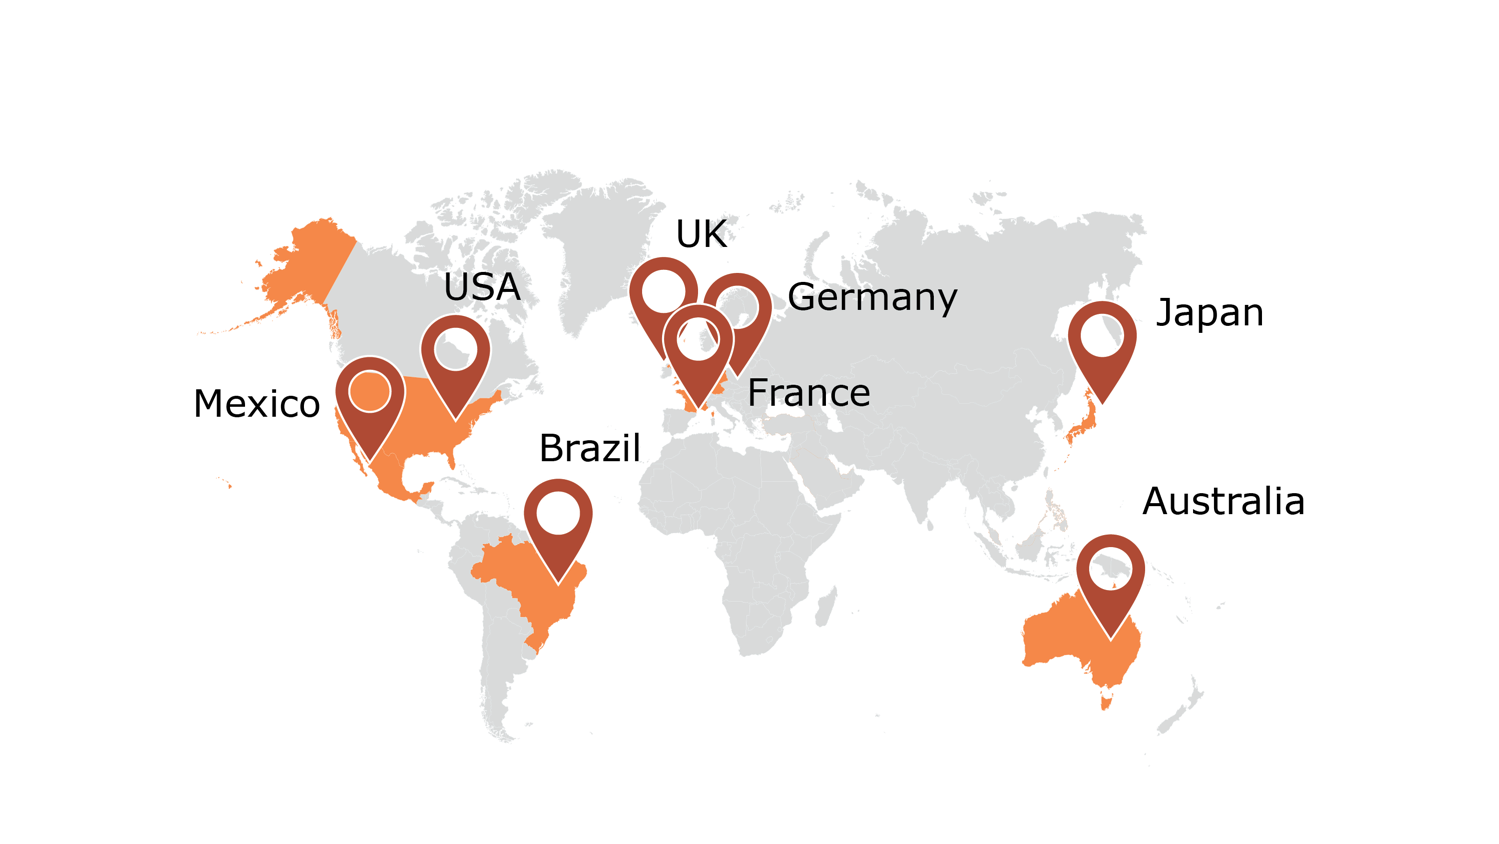
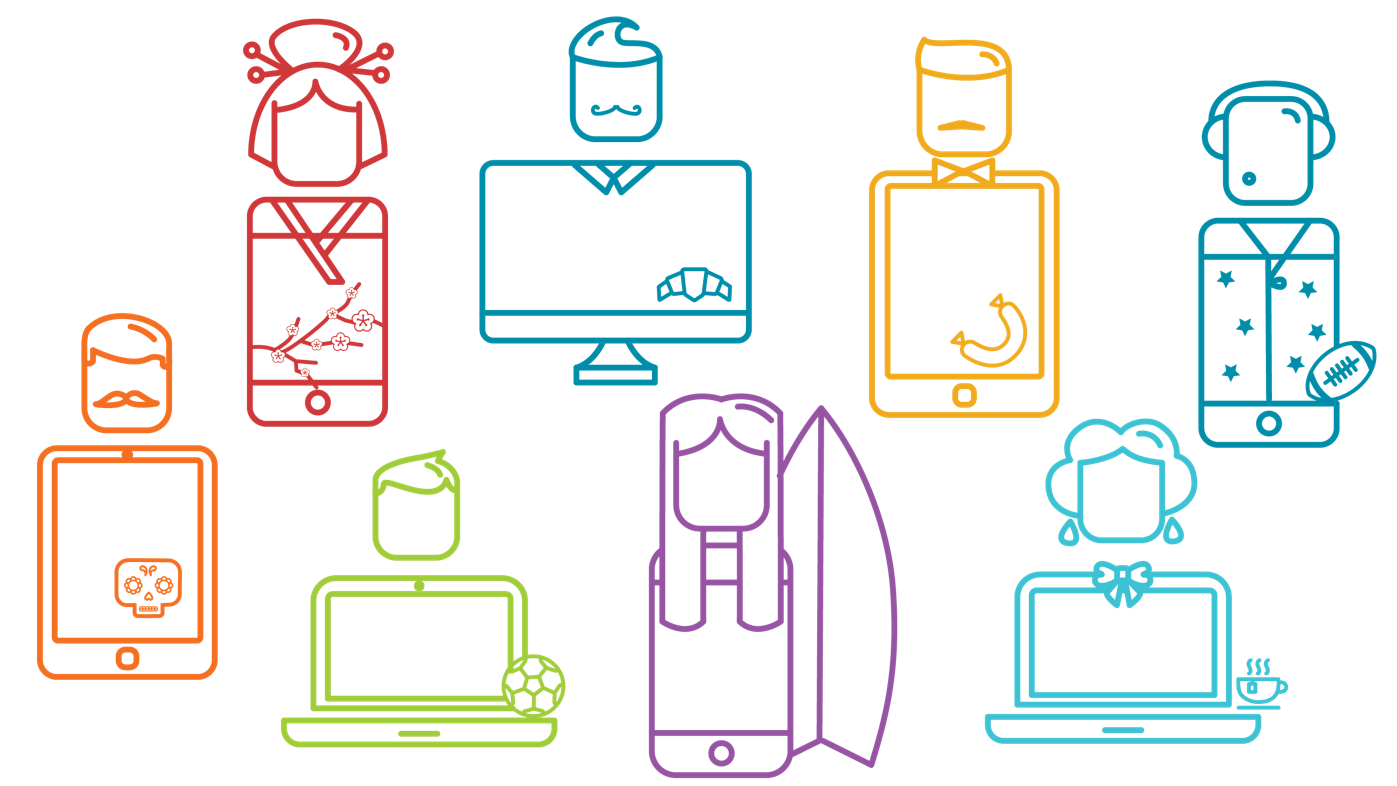 Our research objective was to uncover the differences and/or similarities in cross-device online behavior across countries. For this objective, we chose to study Japan (red with flowers), France (blue with a croissant), Germany (orange with sausage), the USA (blue with football), Mexico (orange with candy skull), Brazil (green with soccerball), Australia (purple with a surfboard) and the UK (blue with a cup of tea). Do you recognize all the countries' symbols? Keep them in mind, because they will appear again later on in this post!
We wanted to see what we could understand about their culture, device preferences, search behaviors, media consumption, and general online behavior by using passive metering.
Research design
We tracked the users over 21 days, from February 20 to March 21, 2017. In each country, we had 500 desktop participants, of which 250 were also cross-device. We kept a fairly even split between male and female respondents and tried to represent as many generations as we could in our study. In total, the time we tracked all the participants together adds up to 17 years on desktop and an additional 11 years on mobile.
This volume of data was almost overwhelming, and it was a monster task to pick out the most exciting, interesting, and useful findings. What we will show here are some of the highlights of our discoveries, to demonstrate what we can observe from user behavior just with passive metering – without having to ask any questions at all.
Research results
Let's start with some easy insights to get the ball rolling – the top sites based on page views aggregated across all participants. Using our own categorization, we could quickly find the most visited websites per category as well.
Top websites
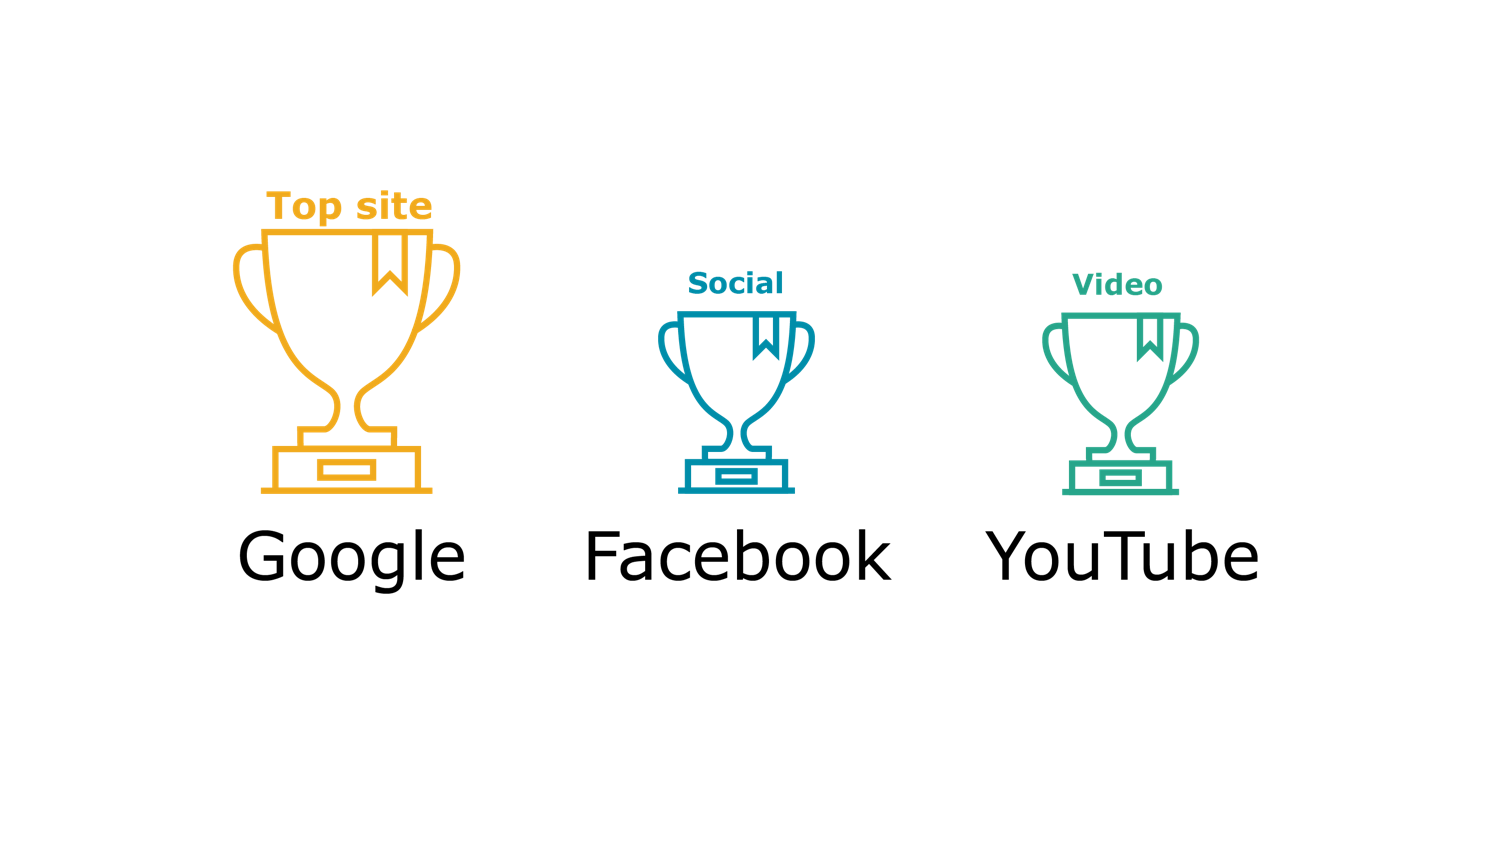
No surprise in the most used site overall - Google was used by participants across the board in every country. Facebook made a strong case for the most popular social media platform, showing up in the top five most visited websites for every age category except <16 year olds. YouTube was the most used website for video streaming and online content consumption. We also noticed that amongst younger people (<16), it showed up very high on their top five list of websites. The older the age category, the lower YouTube showed up in their ranking, disappearing entirely in the top five of anyone over 45. Would these social media platforms still rank the same? We have the sense that Facebook has been decreasing its users since then.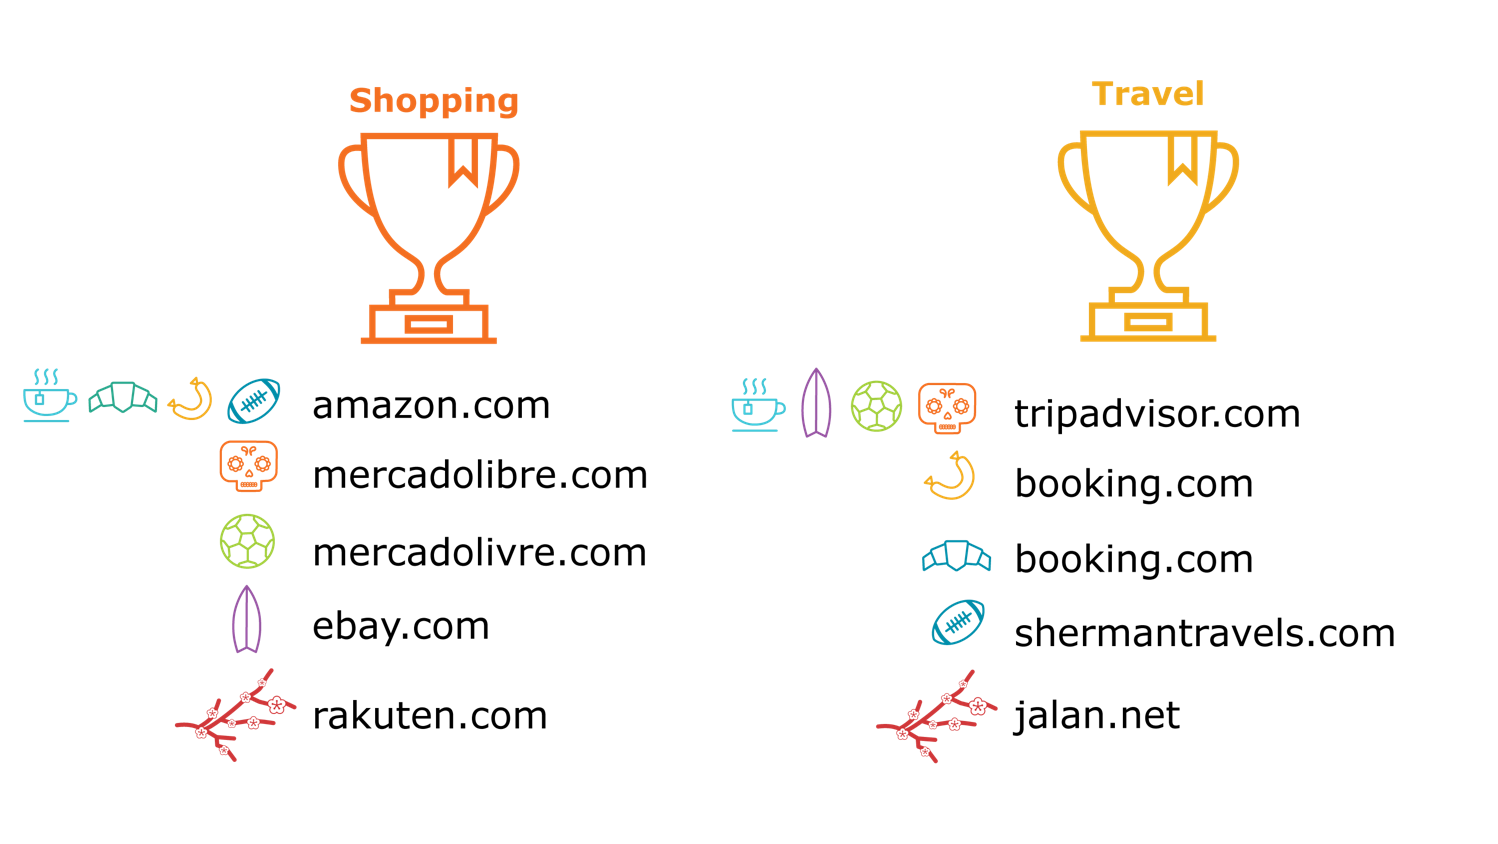 When we examined shopping and travel, we started to notice the first cultural differences. Amazon had very high page views in European countries (France, Germany, and the UK) and, naturally, in the US. However, in Mexico and Brazil, the websites that were used by most people for shopping were mercadolibre.com.mx and mercadolivre.com.br, which is technically the same website, just in Spanish for Mexico, and Portuguese for Brazil.
We were able to see Amazon had not made a huge impact on the Australian market by then when eBay was more popular. This could be due to the fact that Amazon in Australia was very limited, selling only Kindles and various eBooks. It did not have the same range of items and services as it did in other English-speaking countries, which accounts for the discrepancy.
As we will see more often in this study, Japan is an exception in terms of international websites and apps, primarily using their native platforms rather than multi-national ones. Here, they used the Japanese eCommerce giant Rakuten most often for online shopping.
For travel, the top two contenders were Tripadvisor and Booking.com, coming out on top in six out of eight of our countries. Shermantravels.com offers exclusive deals on travel, and Japan is again a native Japanese site, used only in their market.
Top five domains by gender
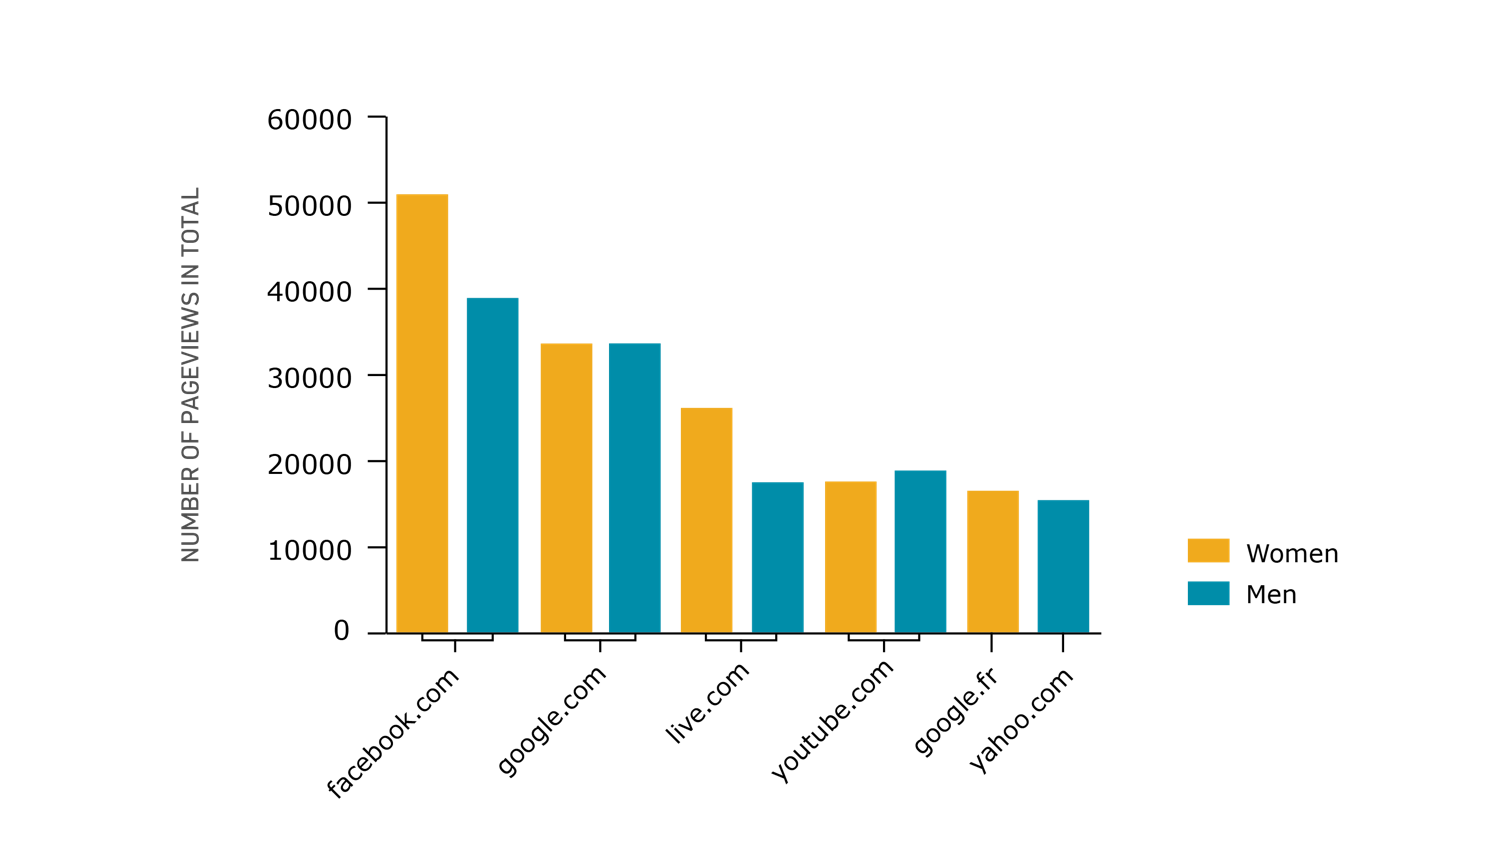
This was one of the insights which surprised us – on the surface, the top 5 for men and women were almost exactly the same, except for one domain. The order of the top five did also differ slightly - men visited YouTube more often and had it ranked at number three, while women visited live.com more than YouTube. However, the difference in the number of page views is also noteworthy. While both genders have Facebook as their number one, women visited Facebook roughly 50% more than their number two, Google.com, while men only visited Facebook on average around 15% more than Google.com.
Unique apps and domains per country
By measuring the average amount of unique apps and domains each country visited, we created the following graph. These numbers do not reflect the domains and apps available to each country but show their actual recorded usage.
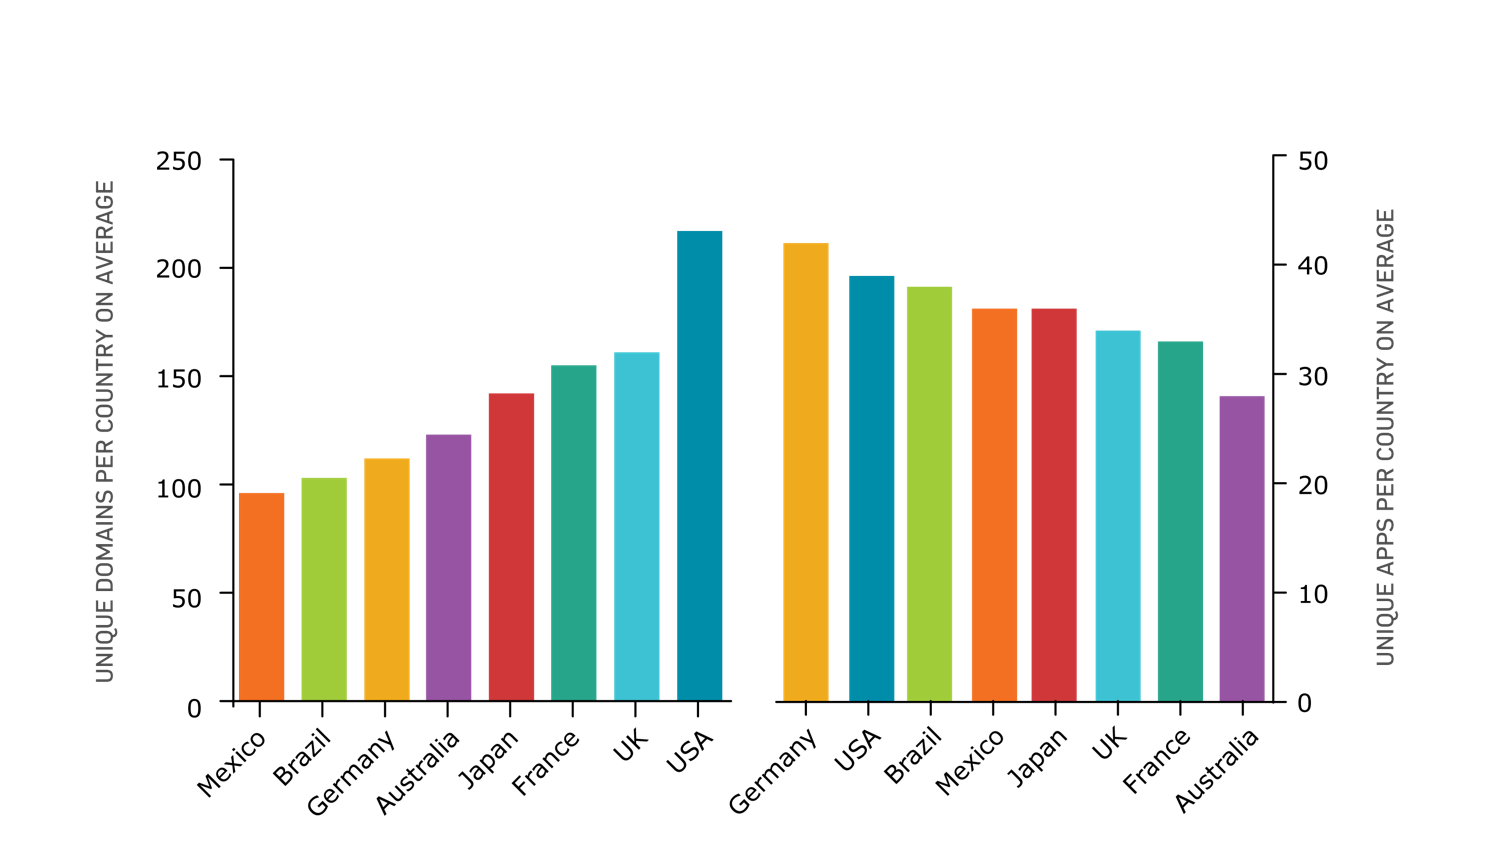
Germans were clearly aware of the range of apps available to them, even though their web domain usage was not very diversified. In the US, people were aware that they have more choices in their online browsing, and subsequently, they were less loyal to specific websites.
Desktop vs. mobile sessions per country
We collated the average session[1] data we collected for desktop and for mobile activity and compared them per country.
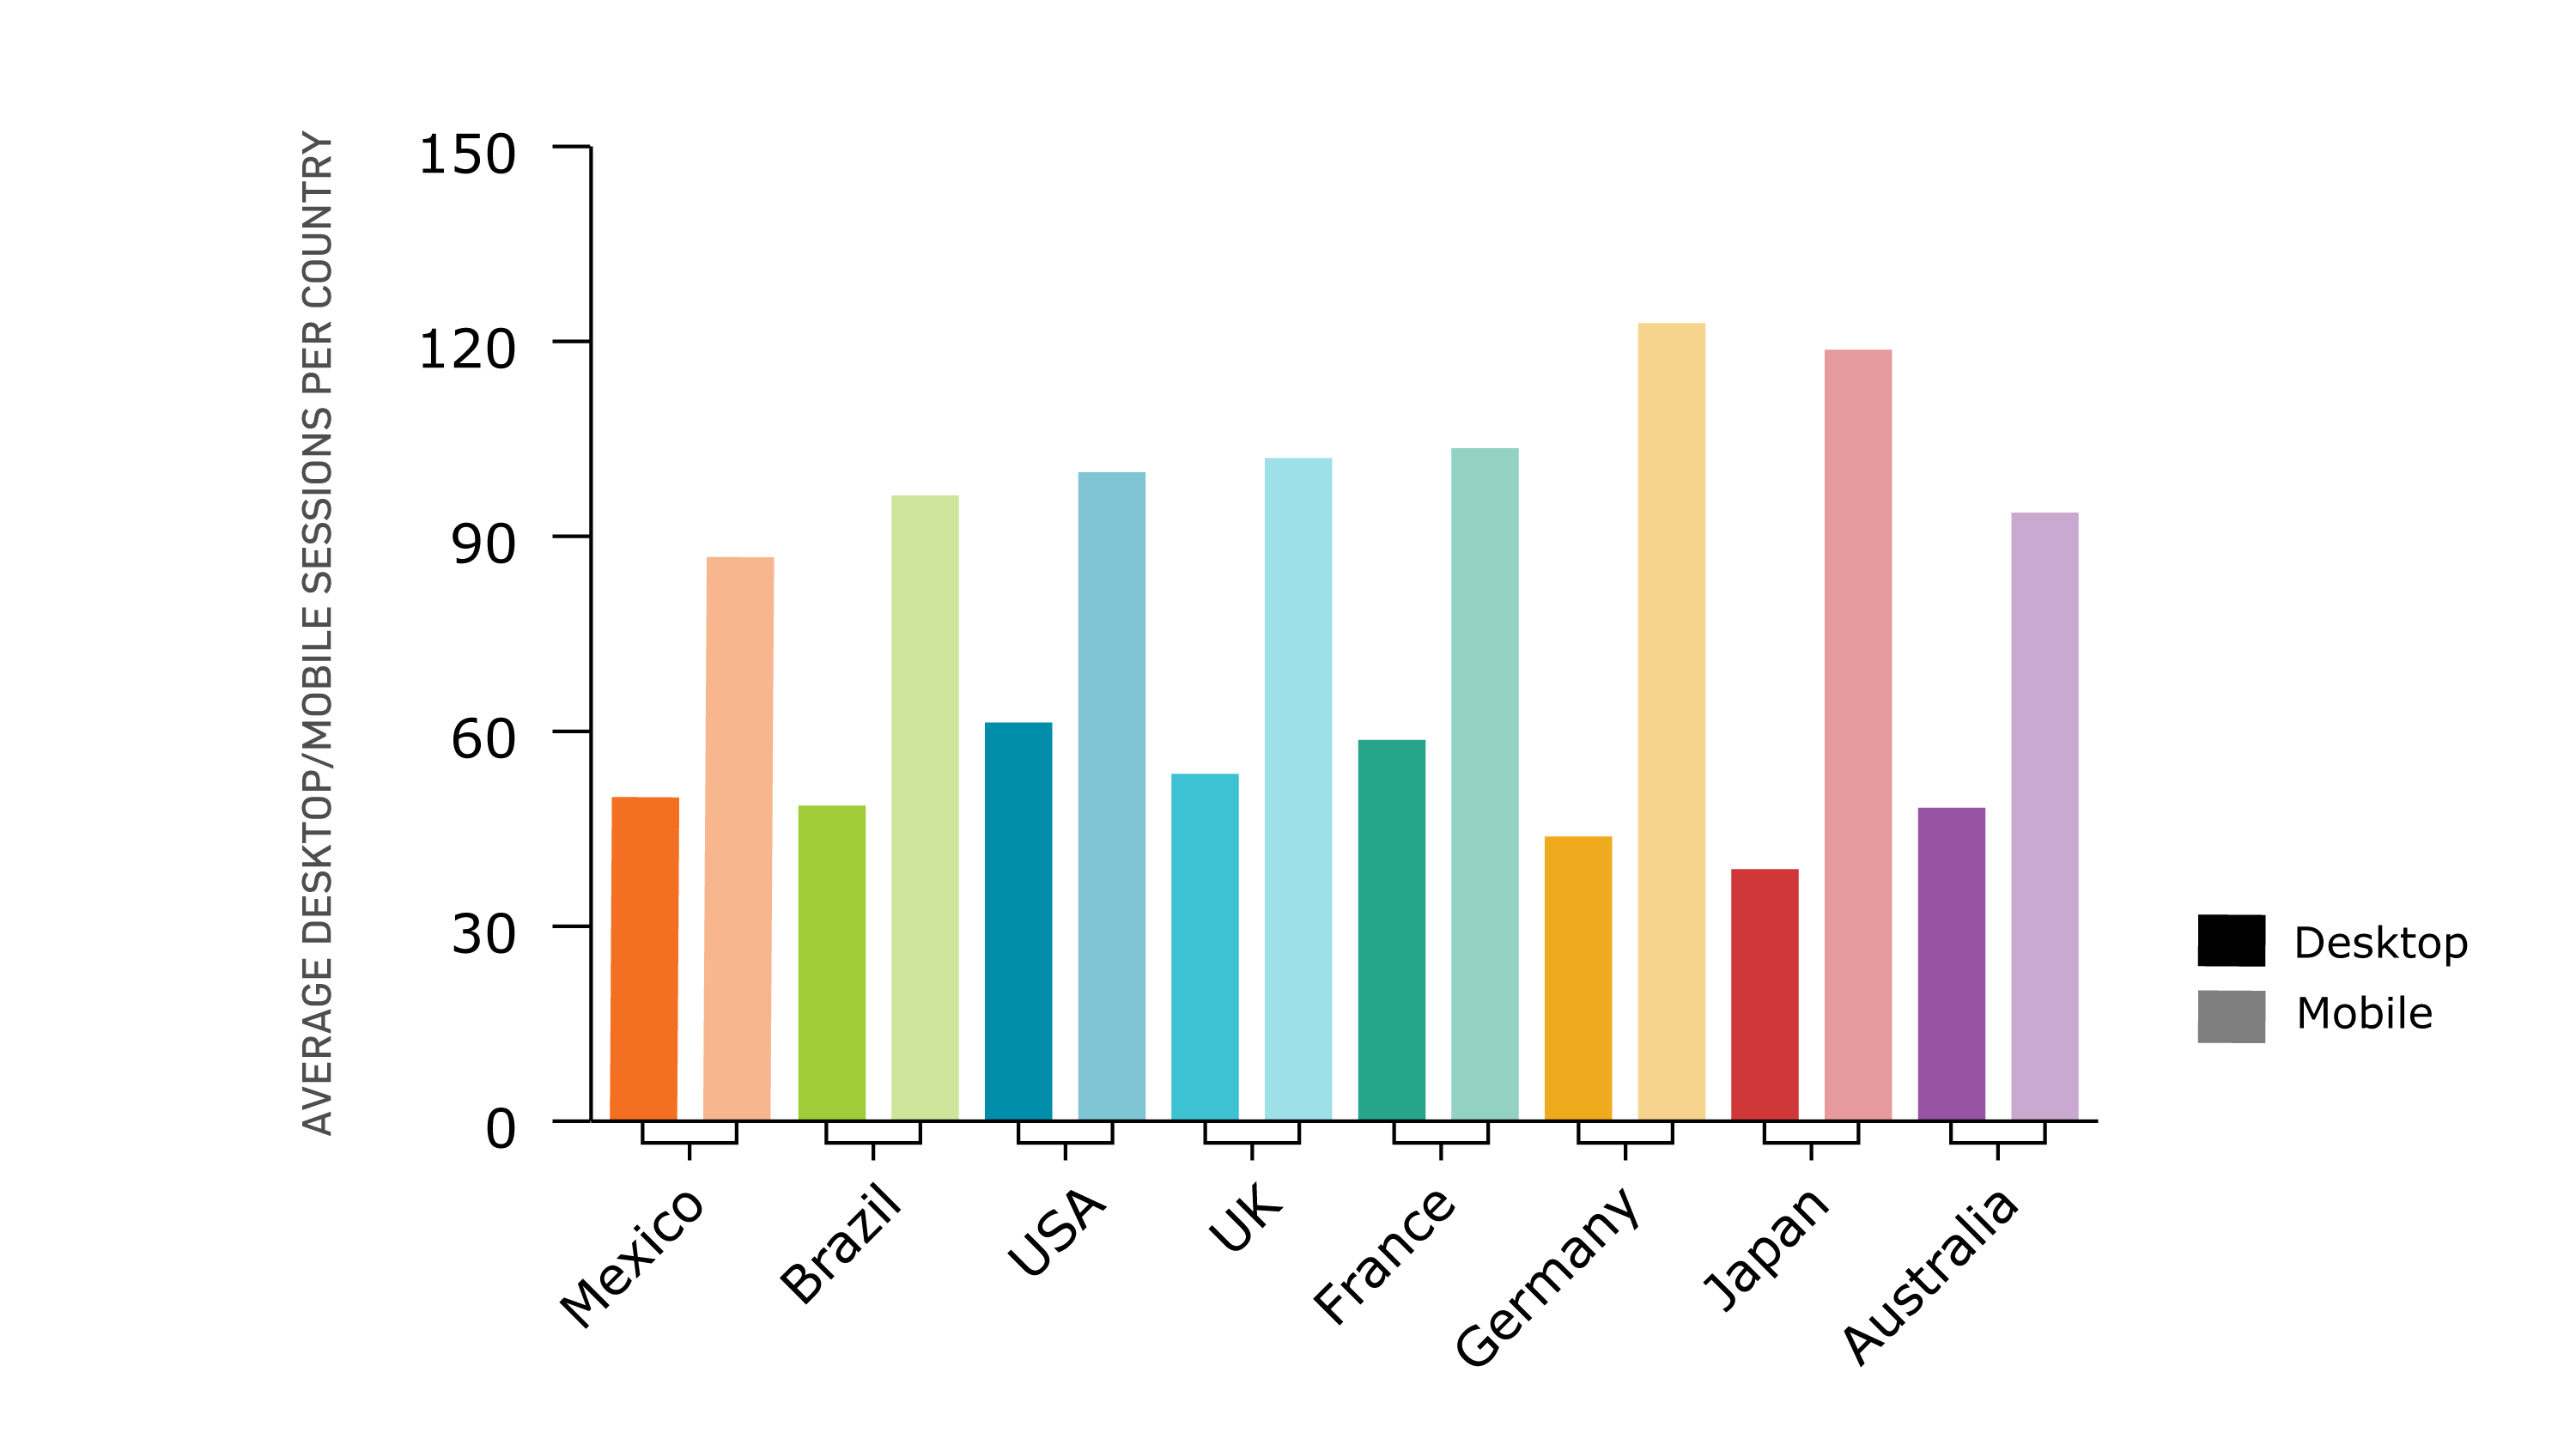 The main insight we took away here is that mobile dominated all markets by a large margin, the biggest difference between the two device types being in Japan. The fact that Germany had the most mobile sessions on average is concurrent with their status as the country with the most diversified unique app usage.
App vs. web on mobile per country
Using our passive metering technology, we also tracked the two types of mobile behavior – apps and browsers. 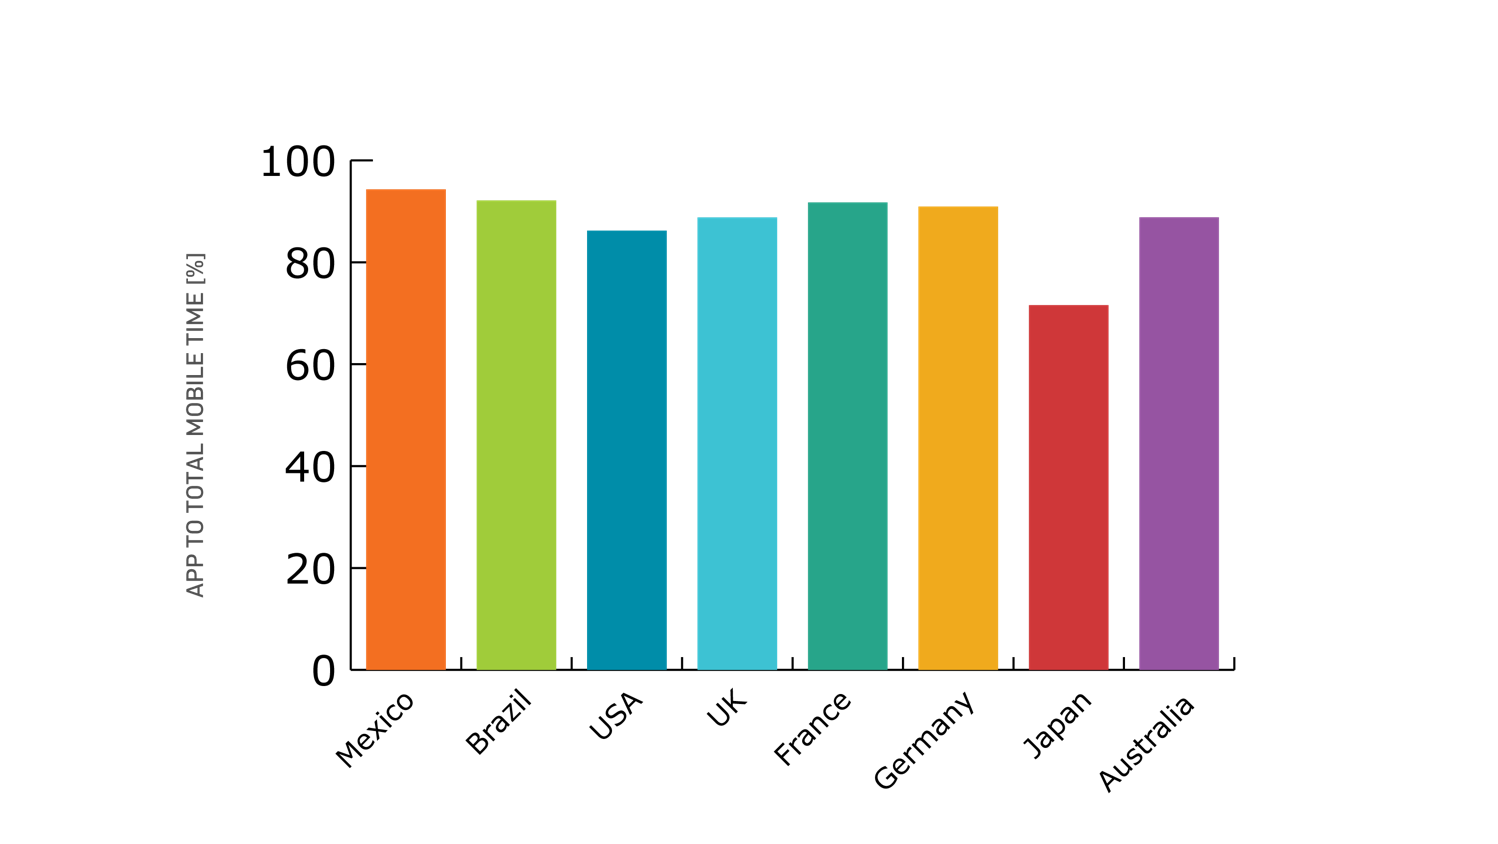
Japan continued its trend of being an outlier by having a relatively low app to total mobile time percentage, hovering around 71% while the rest reaches between 86%-94%.
Time spent on mobile vs. desktop per day per country
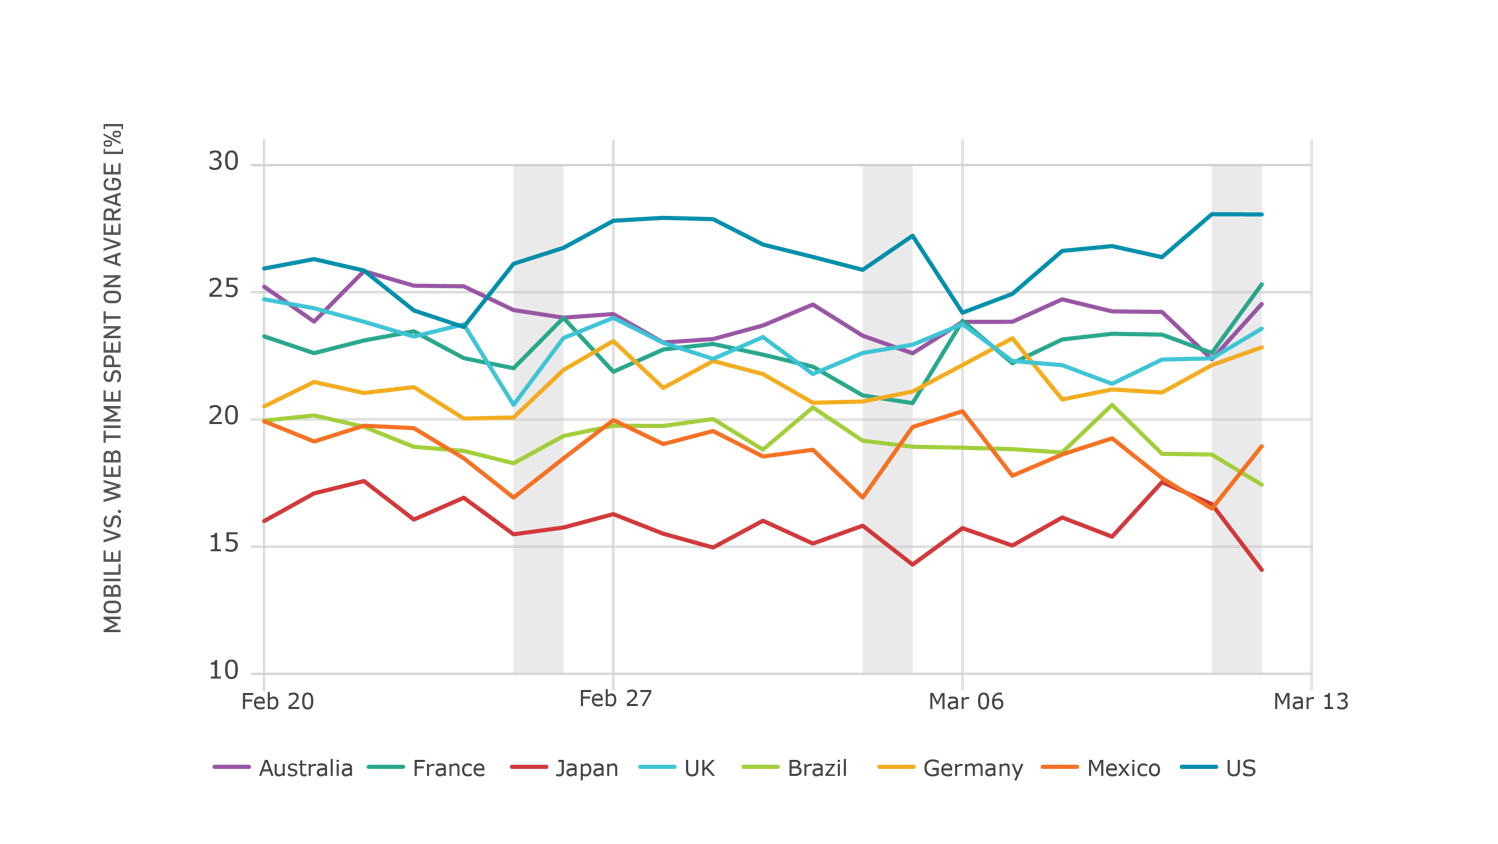 By adding the data from cross-device users on mobile and desktop (on average) together we noticed whether weekends (shaded area), different days of the week or events such as holidays had an impact on which devices they use. For example, we were able to see here that Australia's mobile usage increased during the last recorded weekend, which was a long weekend due to various national holidays.
Most popular hour to be online per country
Another interesting insight we derived from the data is this time-based metric – when people are most active on their desktop devices. 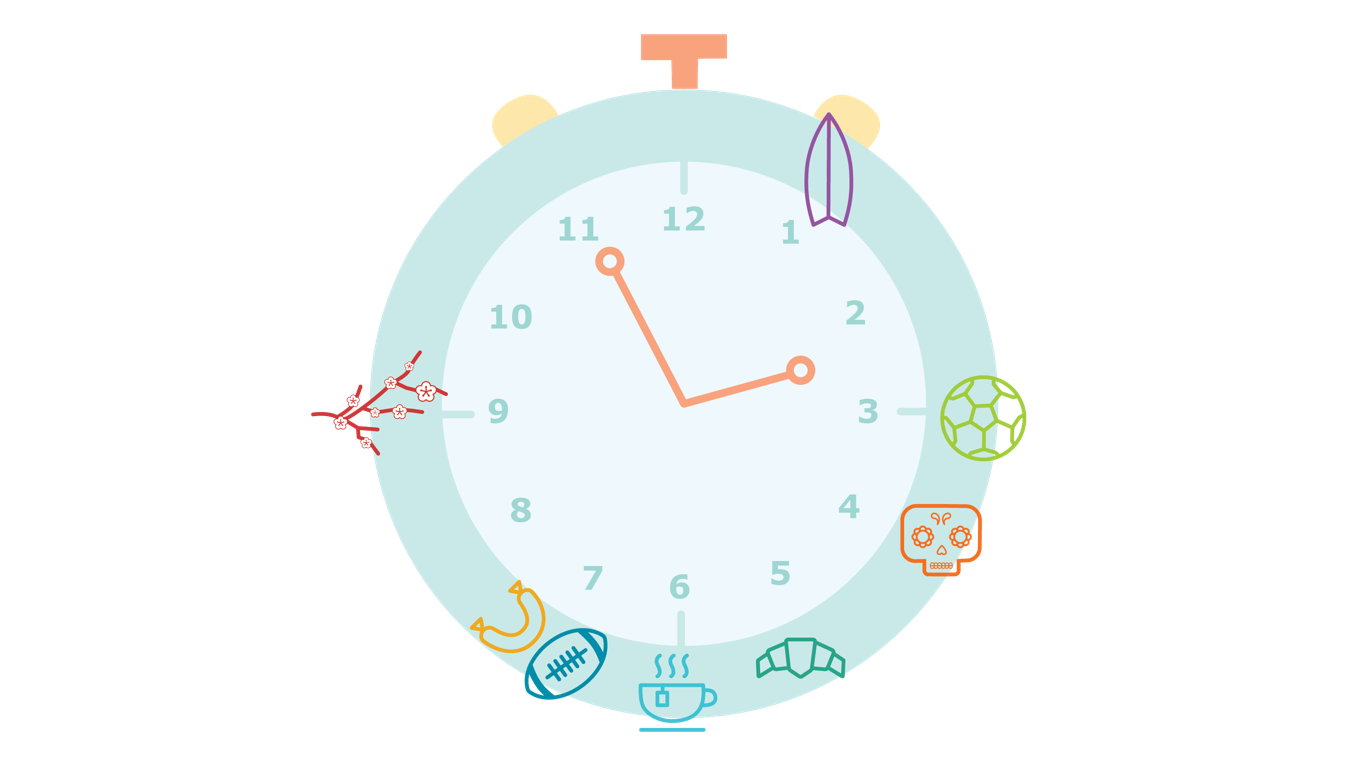
Australians were the only ones with a desktop usage peak at around noon, and once again Japan was the exception, clocking in at a late 9 pm. The Latin American countries (Brazil and Mexico) had their most active period in the afternoon. The rest of the countries were most active from 5 to 7 pm, which is usually the post-school or work period.
Coming up
In the next delivery, we´ll look deeper into specific apps and online content consumption in the different countries. Don't forget to stay tuned!
[1] We define a session as any activity from one participant that occurs without a pause longer than 30 minutes - for example, someone might be searching something on their laptop, close it, and grab their phone to continue their online browsing 25 minutes later. This is counted as one session.